De-Mystifying How We Measure Space: From USF to RSF, and Everything Else In Between
When beginning any workplace design project, a common question we hear our clients ask is how much space do we have to work with? This is a deceptively simple question. When an organization signs a lease for new space, the agreement usually states multiple square footage totals. But when it comes time to design a space, the difference between what the client pays for in a lease and what they have available for use comes into play. Sometimes this difference is misunderstood. Here, we try to boil it down for easy understanding.
The Basics
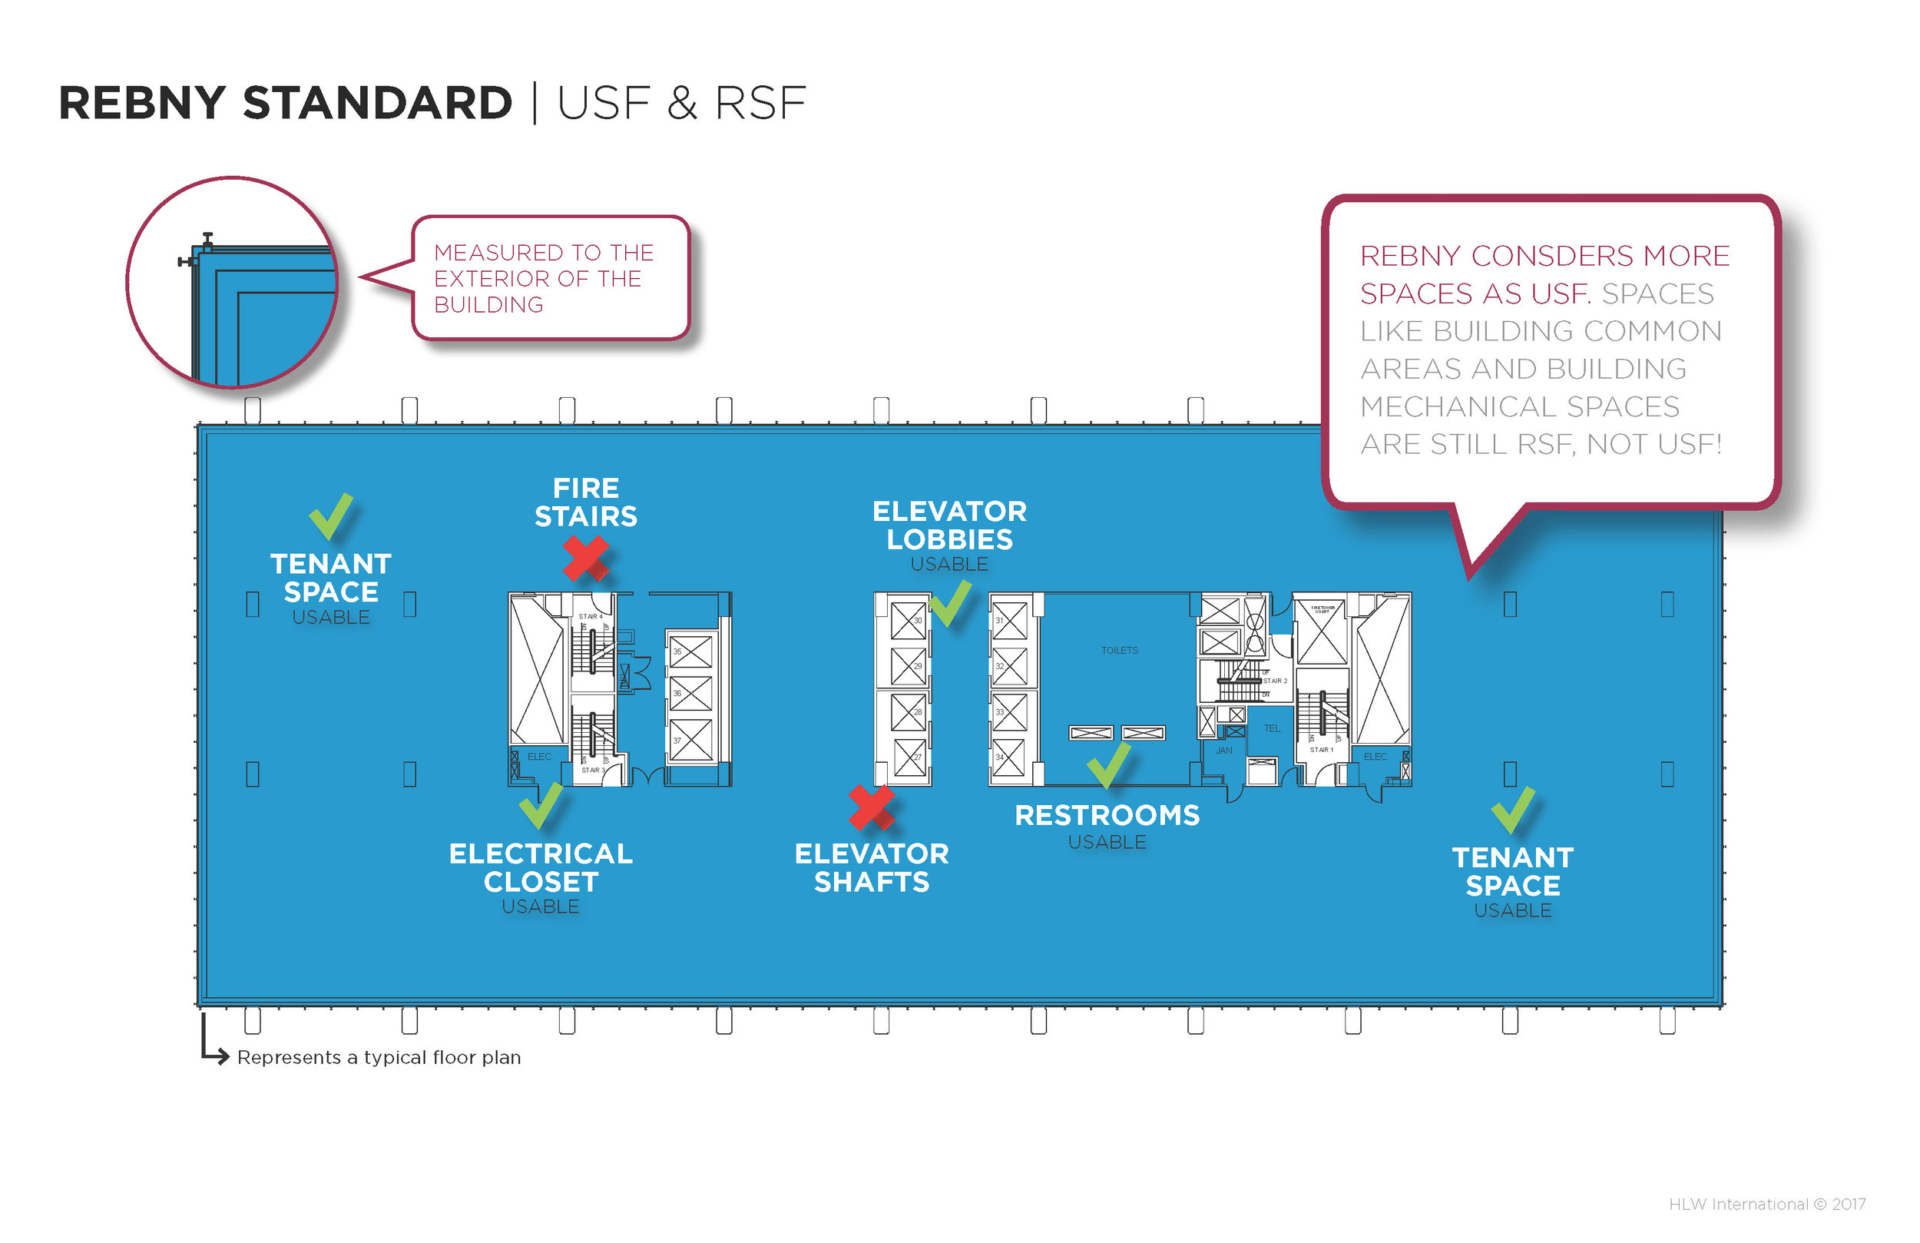
First, there is the Rentable Square Foot (RSF) total, which specifies how much space the tenant leases from the landlord. This total includes the area that the tenant will occupy. It also includes the tenant’s share of building common areas such as lobbies, stairwells, and core spaces.
Second, there is the Usable Square Foot (USF) total, which indicates the amount of space the client occupies. The difference between RSF and USF is called the Loss Factor. Loss Factor rates are market and landlord specific. In the New York City commercial market, a standard loss factor of 27% is the norm. This means for a 100,000 square foot space, the tenant pays for 27,000 square feet of building common area, which leaves 73,000 USF for the tenant’s space. Yet nearby in New Jersey suburban sites, 18% loss factors are more common. So the same 100,000 RSF lease will yield 82,000 USF of tenant space.
RSF & USF calculation formulas are fairly consistent as defined by the Building Owners and Managers Association International (BOMA) industry standard. In New York City, the standards vary slightly, as landlords instead follow formulas set by the Real Estate Board of New York (REBNY) rather than BOMA.
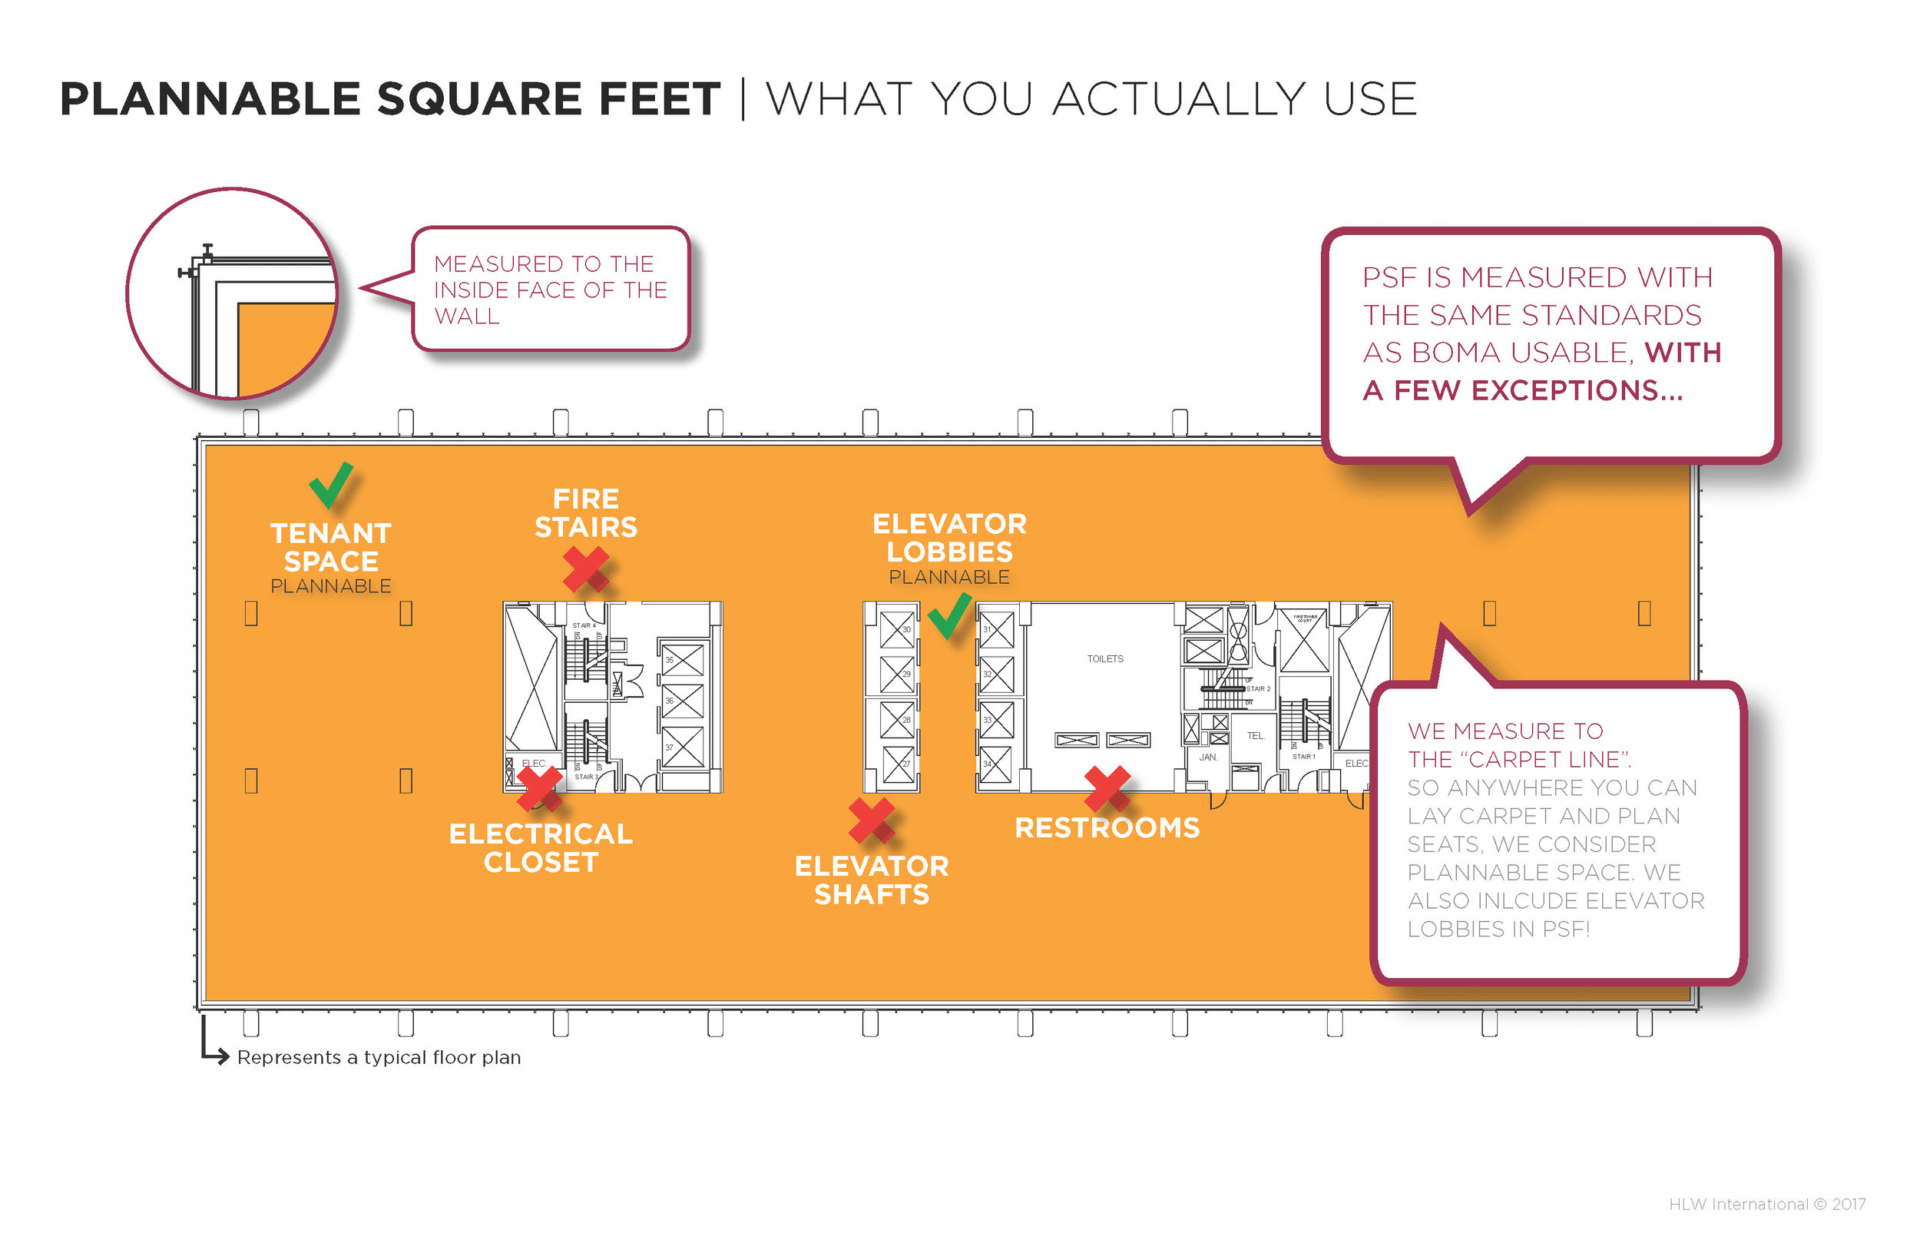
While RSF & USF numbers are helpful in the design process and for establishing an apples-to-apples formula for benchmarking space, there is a third way to look at space that is a bit more precise than the real estate industry’s definitions of RSF & USF. This methodology is an approach generally followed by architects. While RSF & USF are definitions used in lease terms, architects use a number that defines the amount of plannable space. Another way of saying it, it’s the actual area that can be used for planning, designing, and placing people. We call this Plannable Square Feet (PSF). An alternate definition that is sometimes used is Carpetable Square Feet (CSF).
A plannable or carpetable square foot total represents the true programmable area of a floor plate. It’s the amount of space available for workstations, offices, conference rooms, and amenity areas. It also includes area for support spaces such as storage closets, mailrooms, file areas, and copy areas (pretty much everything that’s not part of the building core).
Finally, it also includes circulation. The percentage of the plannable area devoted to circulation is often referred to as the Efficiency Factor. In the U.S., many typical corporate clients with open office layouts devote about 30% of their plannable area to circulation – the space where people walk and the areas between desks. Some work areas are more dense (or efficient) and may only use about 25% for circulation. In less expensive markets where space is cheaper and where density isn’t a huge driver, circulation factors of 35% to 40% are not uncommon. Typical circulation rates and benchmark efficiency factors vary when planning specialized work environments like media broadcast spaces, studio spaces, lab buildings, conferencing centers, or other work environments with a high proportion of enclosed office spaces or specialized settings.
Plannable or carpetable areas exclude bathrooms located in the building core, egress stairs, elevators, vertical shafts, MEP rooms, elevator lobbies, and electrical/telephone closets.
Making Metrics Work for Your Organization
Once you understand the basics of RSF, USF, and plannable space, the next factor you’ll want to consider are some metrics. Organizations typically consider how their space relates to their headcount. In other words, how many people does any given space support? One of the most common metrics used by architects is USF per seat. The calculation is a simple dividing of the total USF of a space by the seat count. In a setting where every person is assigned a seat (1:1 ratio of seats per people), this is relatively intuitive to grasp. In a hypothetical 100,000 USF office with 667 seats (and 667 people), you arrive at 150 USF per seat.
However some settings are designed to support mobility and desk sharing. In these cases, not everyone gets an assigned seat. So the appropriate metric would be USF per person. The calculation would divide the total USF by the number of people the space supports. Imagine this hypothetical 100,000 USF office supported 900 people with 667 seats (sharing ratio of 1 seat for every 1.35 people). You would still get 150 USF per seat (100,000 divided by 667). But the USF per person would be 111.
The USF per person and USF per seat metrics are usually based on counts of desk seats (typically defined as workstations, cubicles, benching seats, and enclosed offices). But every floor plan includes a mix of collaborative seats found in meeting rooms and open areas. A useful metric to consider is the ratio of desk seats to collaborative seats.
We all know that most people don’t sit in the same seat all day long. People meet in conference rooms, brainstorm in open meetings areas, and meet colleagues for coffee in social areas. Clients often ask us how many collaborative seats they need. A useful metric is to look at the ratio between the number of collaborative seats to the number of desk seats. In amenity rich tech company offices, creative company offices, or offices that support high ratios of mobility and desk sharing, the ratio of collaborative seats to desk seats is around 1:1. In a more traditional office where with 100% assigned seats, the ratio is often closer to 0.5 or 0.6 meeting seats for every 1 desk seat.
Some Rules of Thumb
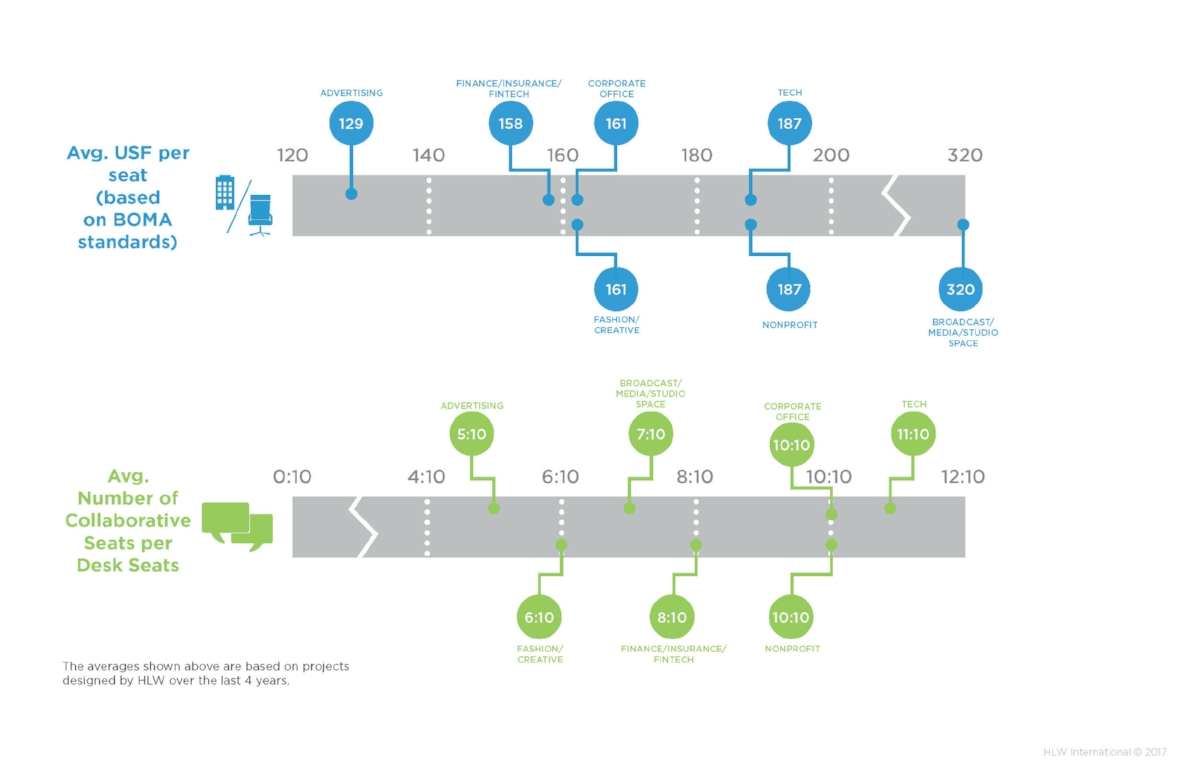
The following table summarizes planning trends by industry. The averages shown below are based on projects designed by HLW over the last 4 years.
FAQ’s
Clients often ask us related questions. We have compiled a list of frequently asked questions below to help clarify some of the common inquiries about space planning metrics
What are the main differences between USF and RSF, based on the BOMA standard?

What are the main differences between USF and RSF, based on the REBNY standard?
What are the major differences in how BOMA and REBNY define space?

If I am programming a space for my organization, how do I know how much space I can actually plan?